

The following is a list of figures for attack distribution of CIDD Data Set
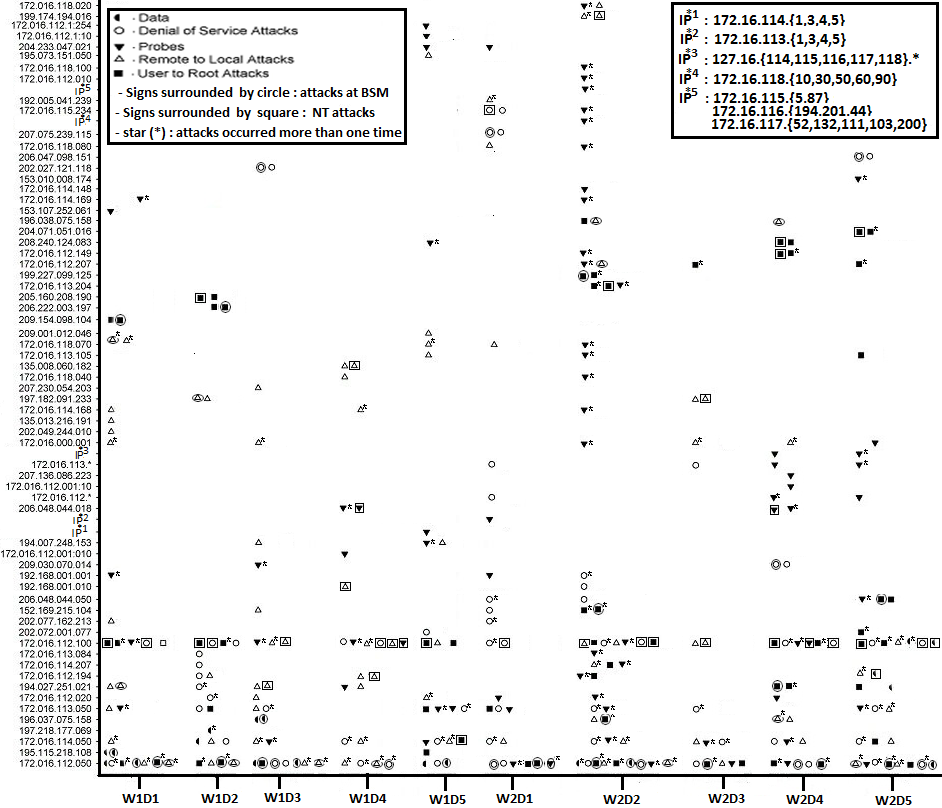
Figure1 shows the attack distribution in the training data ( Solaris BSM, windows audits and TCP-dump data)

Figure 1
Figure 2 show the Masquerade attacks distribution in week 6 of Part1and the two testing weeks of part2 �

Figure 2
Figure 3 show the attack distribution in
testing data of part1 (Solaris BSM and TCP-dump
data)
�
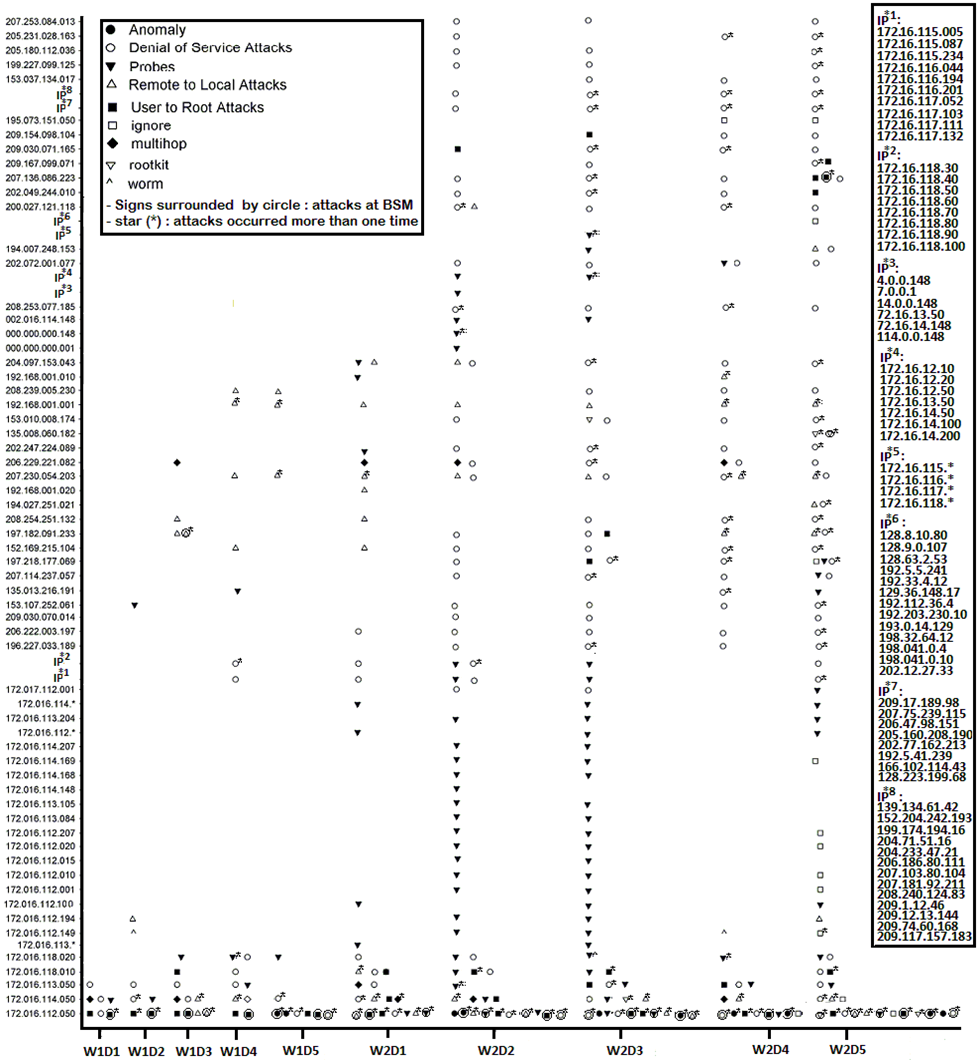
Figure 3
The following Figure show
the attacks distribution in testing data of part2 (Windows audits
and TCP-dump
� Figure 4