


The Log Analyzer and Correlator System
LACS is alog analyzer and correlator system that parses and correlates user audits from their low level format log files and that parses the binary log files collected by Unix Basic Security Module (BSM), the security, application and service log files of the Windows event log system, and the raw packet data. They collected the log files and the TCP dump data from Eyrie Air Force Base network ,Look for the Eyrie Air Force Base network
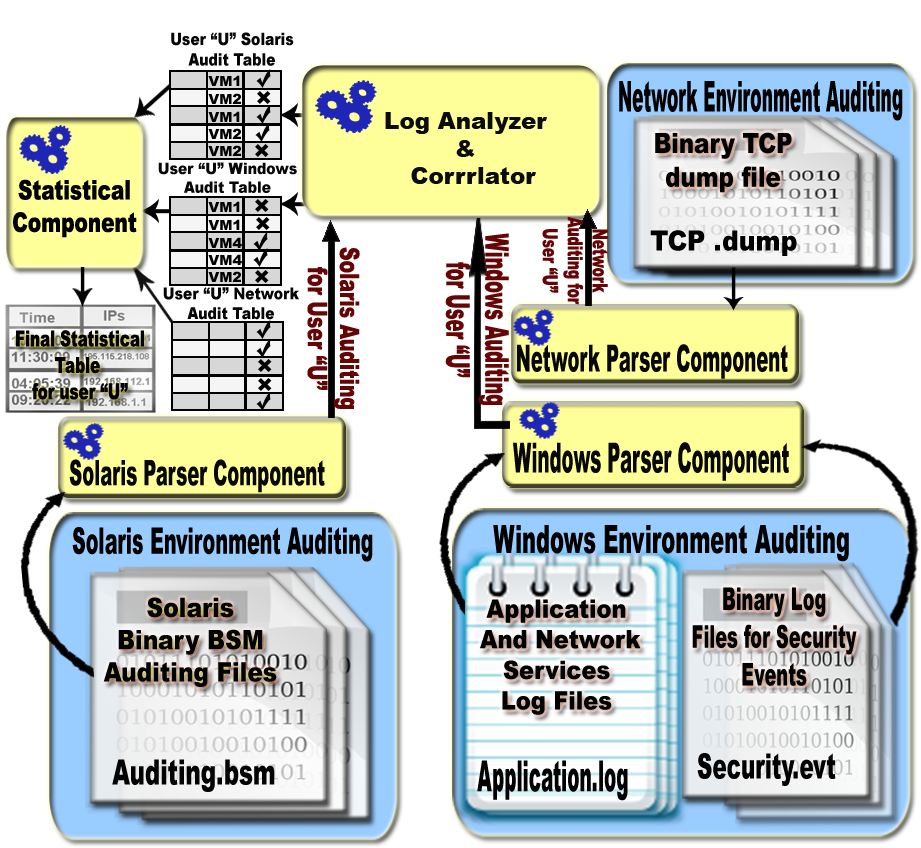
The Following figure shows the architecture of LACS.
Parser components for LACS
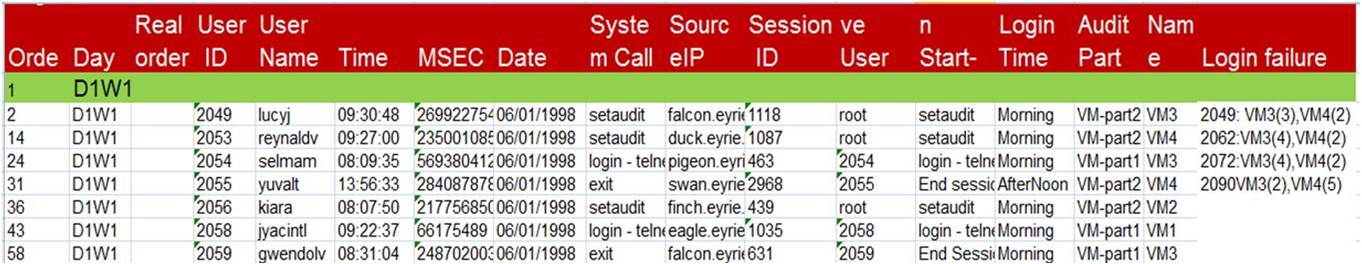
1- Solaris parser:
The
Solaris C2 audit daemon (the auditing capability
of BSM) writes binary event data to the local
file system e.g., ?Auditing.bsm?. Our parser
reads this file and converts its audit events
into a readable text format. Then, it sends the
converted audits back to a local file
(?Unix-parse.audit?) in the same order that was
entered by each user. This file can be analyzed
later by the log analyzer and correlator
component. The parser extracts the following
parameters: user id, user name, day(e.g., D1W1
means first day of week 1), time(format
hh:mm:ss, Millie seconds), system calls
[27](e.g., setaudit, open-read, login-telnet,
logout, execve, mkdir, rmdir...etc.), path (for
commands, files, or directory), login source (IP
address or URL), session id, effective uid ,
attributes and arguments for system call, and
return value (success or failure of the system
call).
An example for CIDS Solaris Auditing Data
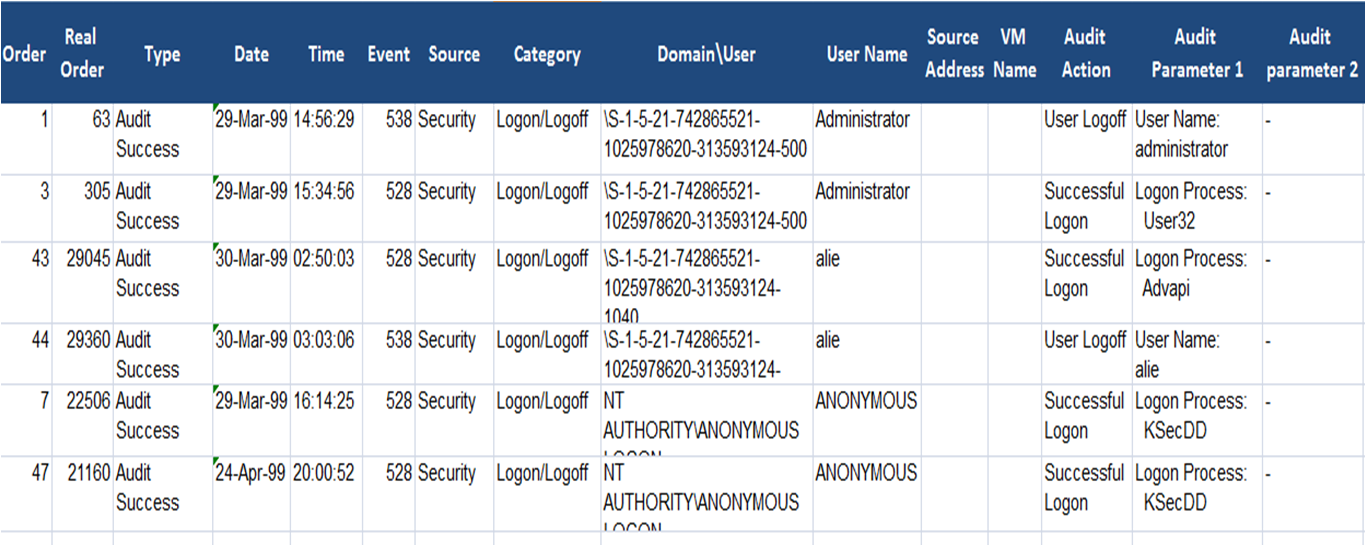
2- Windows parser:
This parser
reads the primary binary/encoded Windows security event, and
application and service log files (e.g., ?Security.evt? and
?Application.log?), and converts them to a human readable format.
Then, it sends them back in the same order to a local file
(?Win-parse.audit?), which is analyzed by the log analyzer and
correlator component. The parser extracts from the security event
log files the following parameters: type (audit success or fail),
day (e.g., D1W1 means first day of week 1), time, event id, source
(security log in this case), audit category [28] (e.g., system
event, object access, detailed tracking, privilege use,
logon/logoff, account management?etc.), user id, user name, audit
action (e.g., object open, handle closed, a process has exited, a
new process has been created, successful logon, logon failure, user
logoff,?etc.), audit parameters (e.g., object name, handle id,
privileges, etc?), and description. The parser extracts form the
application and service log files the following details: source
machine (IP address or URL), user name, Day (e.g., D1W1 means first
day of week 1), time, service or application name, source port,
destination port, and target(website, file, email, etc...). Most of
these applications and services are web applications and mail
services.
An Example for CIDS
Windows Auditing Data
An Example for training data ( sequence of mail and web service )
.png)
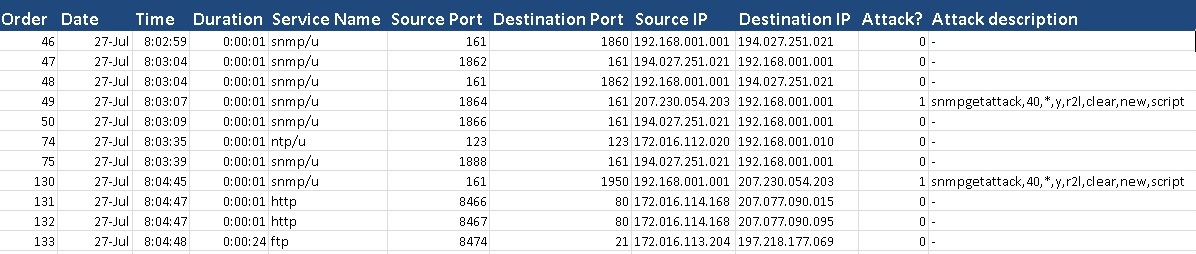
3- Network parser
This parser extracts user
audits from the raw packets data files (e.g., ?In&out.tcpdump?)
collected by the TCP-dump software. The data contains information
about the activities of the user source machine. The parser extracts
from the TCP dump files the following details: day (e.g., D1W1 means
first day of week 1), time, duration, service/protocol name, source
port, destination port, source IP, destination IP, attack? (1 if the
packet has an attack signature and 0 otherwise), and attack
description which describes attack type, if it is clear or stealthy,
and if it has a new signature or not.
An
Snapshots for
TCPdump data with labeled attacks
LACS Functions:
It is the core component in the system. It performs the following tasks:
(1) It correlates the user audits in host and network environments using user IP and audit time, and then link all these audits to their corresponding user.
(2) It assigns user audits to a set of VMs according to their login sessions time. During audit collection experiment, each user logs into the network in one or two different time shifts, one in the morning and the other in afternoon or evening and sometimes both. The Log analyzer and correlator component assigns user morning sessions to one VM and the other sessions to another VM. It also takes into consideration the category of the task that user performs to assign its session to the right VMs. We will see in section 4.2, the distribution of the users to the VMs.
(3) It marks malicious audit records for each user according to attacks and masquerades tables given by MIT group [26]. Marking operation done according to attack time, date, destination IP/URL and the name of victim user. It also marks some audit records which belong to a session with different time and/or different source IP than the training audit data stored for the user.
(4) It produces the final tables that store the marked audits for each individual user with its assigned VMs. Three tables are produced in this step namely, Solaris, Windows, and network audit tables, each with a different sequence of audits. The Solaris table contains a sequence of user actions e.g., system calls, command lines, opened or written/read files. The Windows table stores a sequence of user actions e.g., security actions and opened applications and services. The Network table contains some valuable information for the sequence of accessed machines, network services and protocols used by the user, and normal times and dates of user accesses. These three tables enable any IDS to follow the sequence of user audits in different environments. The masquerade detection equation that correlates between these three tables? audits is given in Eq.1:
Eq.1
Where:
-
PCmasq(Ui)
is
the probability that Ui
is a masquerader according to his behaviors in
all his participating host machines in the cloud
system, and
includes
the probability that the
masquerader can be detected by the login IP(s).
- P(Ui) is the probability that Ui is a masquerader according to his behaviors in all his participating host machines in the cloud system (does not include user IP behaviors).
- ?m? is number of IP(s) that Ui uses to login to the cloud network.
- ?n? is number of users in the cloud network who share the sameIp j of Ui
- ?k? is an index for the current user who shares the same IP of Ui
- ?j? is an index for the current IP address of Ui
-
P(
Ip j )
is
the probability that
Ip
j
reveals
to be a masquerader.
The statistical component
It builds host and network based statistics according to the three previous tables. Host based statistics include: number of login failures, logging times (morning, afternoon, evening, and nights), logging source address(es), a list with common commands and system calls used by the user (in case of Unix Solaris system), a list of common services, applications, and security actions (in case of Windows NT), and VMs names used by each user. Network based statistics are based on the IP address and include: list of network services and protocols used by this IP, list of machines accessed by this IP, hours and days at which the IP becomes active, list of failures by this IP.